Understanding Product Impact on Average Order Value Trends
Analysis > AOV > AOV Bins > Product Mix
Summary
The report provides a breakdown of how various products contribute to overall sales, helping you understand customer spending patterns across different products. This report allows you to analyze the distribution of orders across different AOV bins and link that to specific products to see how product sales affect your overall performance.
Questions the report answers
- What is the distribution of orders across different AOV bins?
- How has the order mix changed compared to the previous year?
- Which products are driving higher Average Order Values?
How to read the report
Understanding AOV Bins and Order Mix
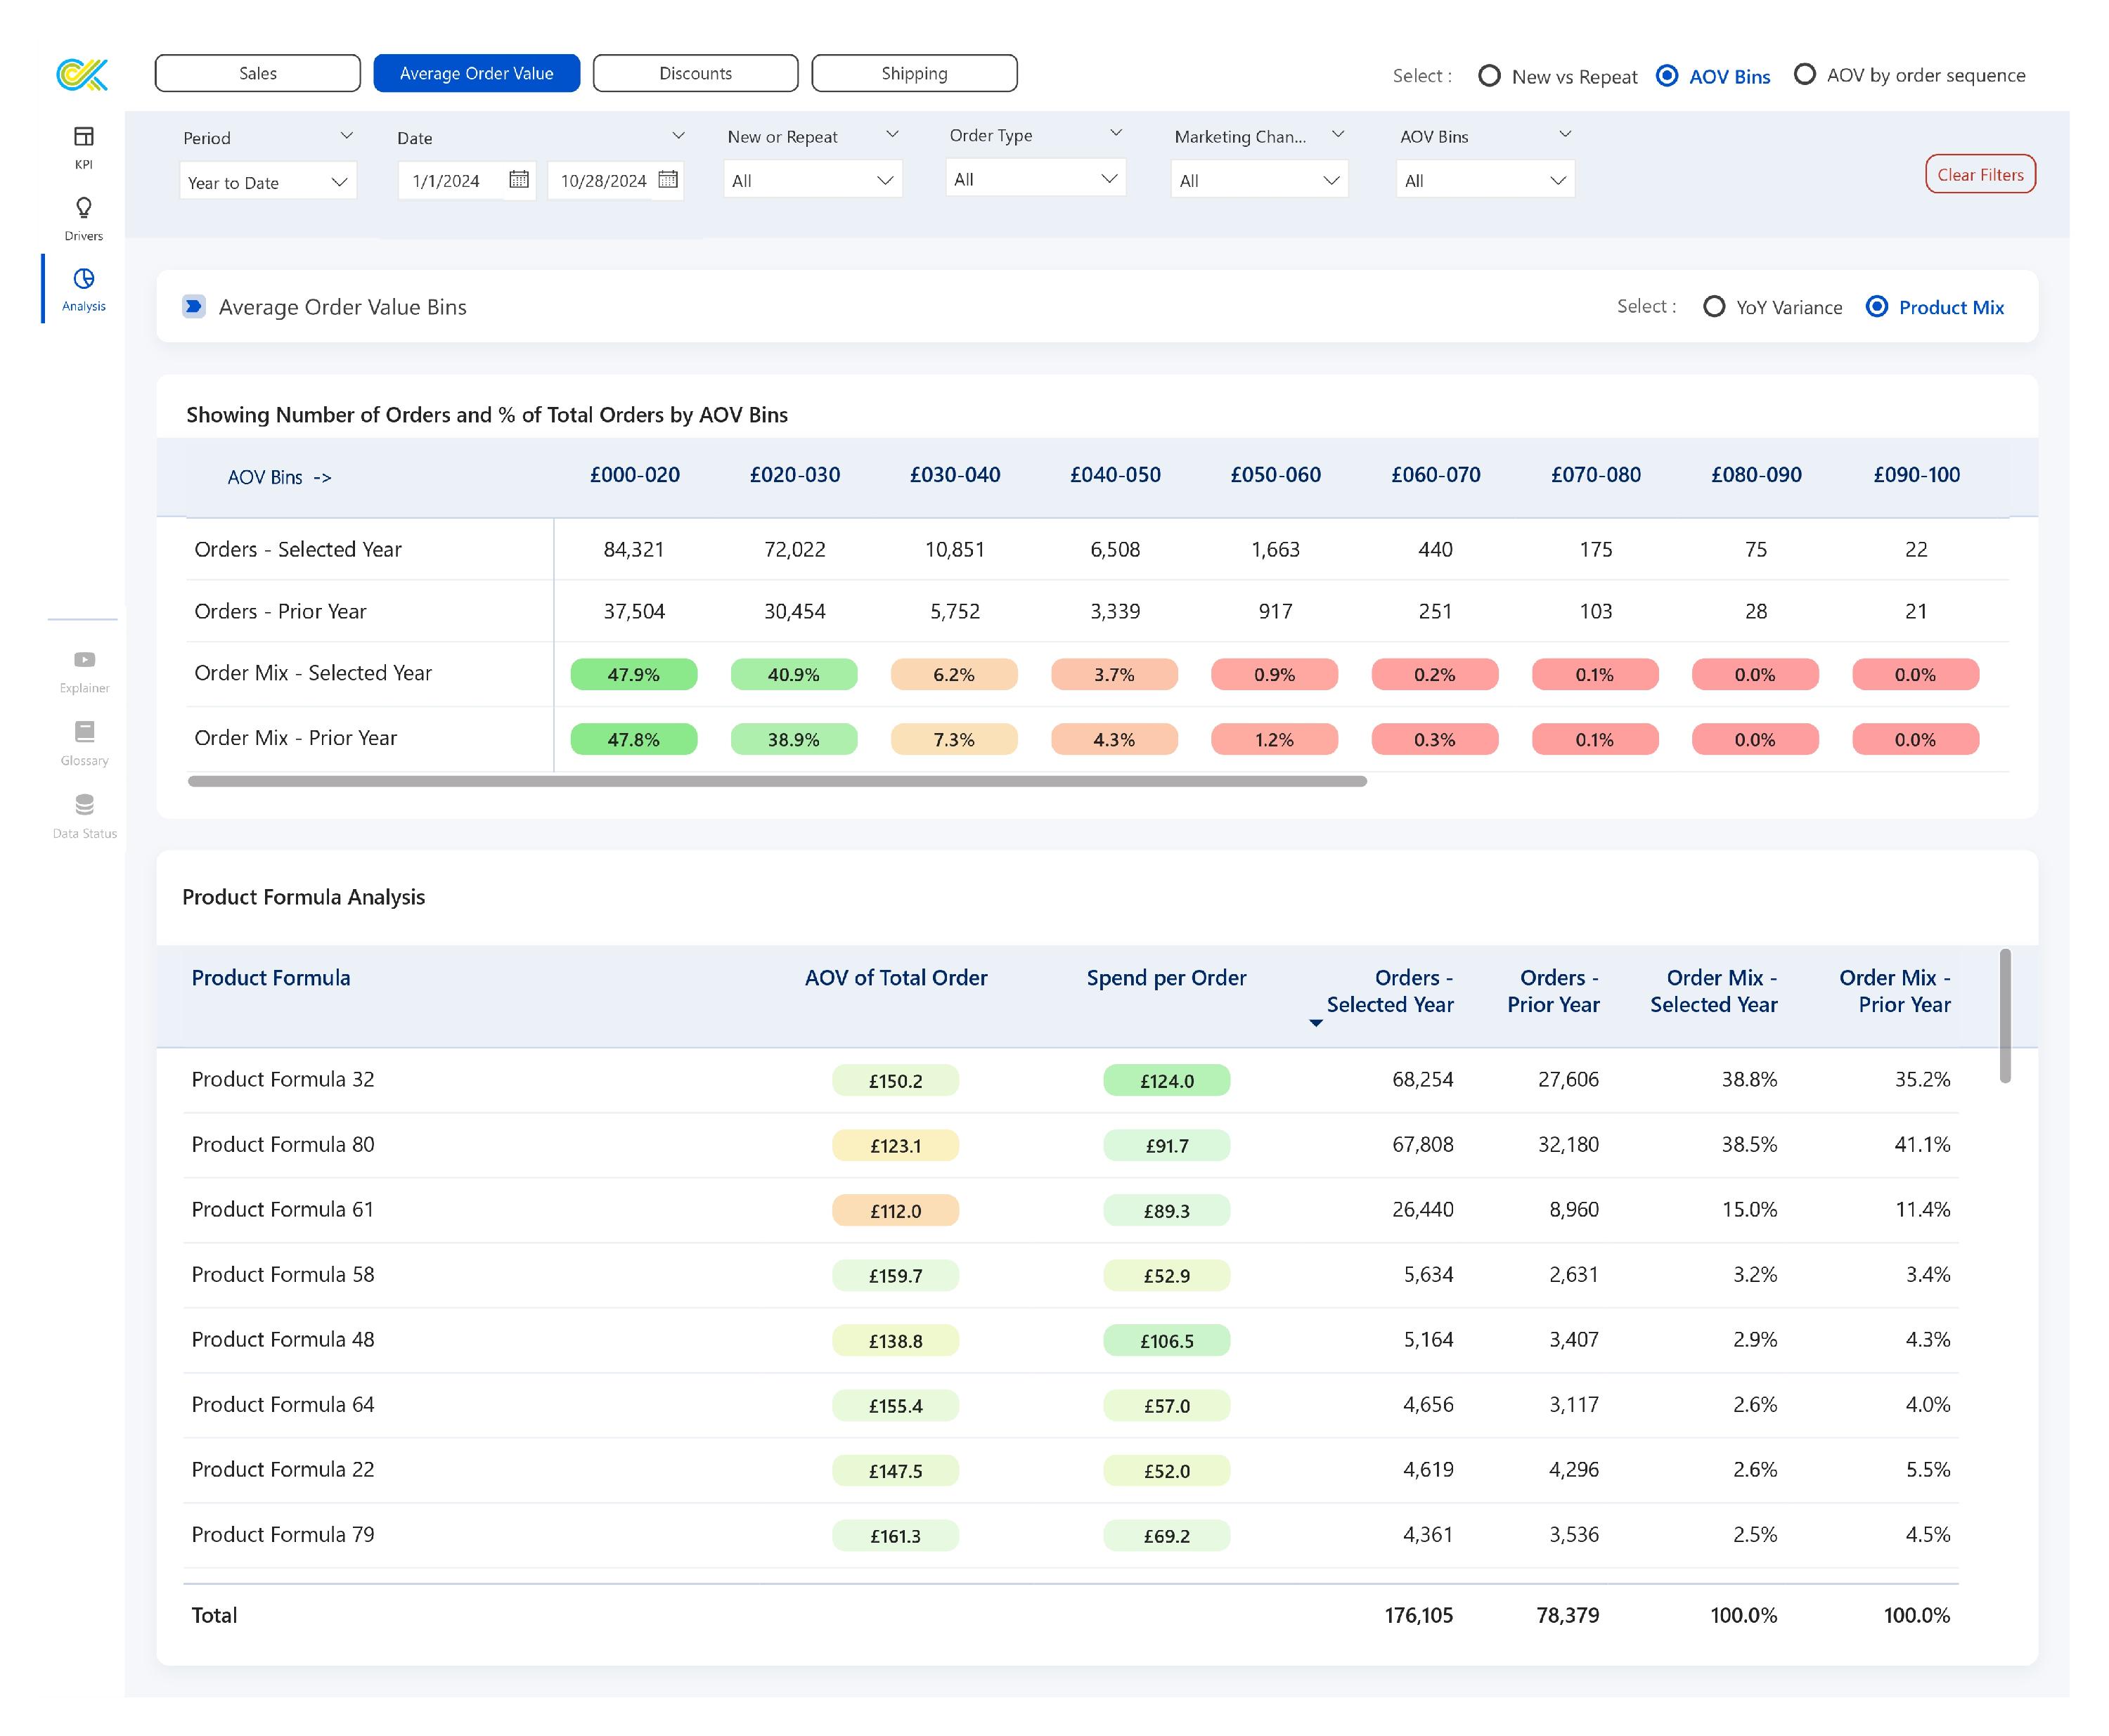
The first section of the report shows the number of Orders and the Order Mix (% of Total Orders) that fall into each AOV bin (e.g., £0-20, £20-30, £30-40) and compares them with the prior year.
You can identify which AOV bin is most and least active by accessing the concentration of the number of orders in a specific AOV bin. Further, you can understand the growth or decline in the number of orders for each AOV bin.
The comparison between the Selected Year and Prior Year order mix helps you to identify shifts in customer behavior. In this example, the £20-30 AOV bin increased from 46.3% to 48.9%, which means that more customers are spending in this range compared to the prior year. The order mix in the £30-40 and £40-50 bins declined slightly. This may suggest that while you're successfully converting lower spenders into mid-range spenders, you're not yet able to convert mid-range spenders into higher-value customers.
Product Analysis
The second section of the report breaks down the AOV of Total Orders, Spend per Order, and Number of Orders across the products
- High AOV of Total Order, High Spend per Order: Suggest that these are premium or high-ticket items driving large transactions.
- Low AOV of Total Order, High Spend per Order: Indicates this product is purchased alongside lower-value items, but customers spend significantly on it.
- High AOV of Total Order, Low Spend per Order: Suggests that while customers may place large orders, the product itself isn’t contributing significantly to the value of the transaction.
- Low AOV of Total Order, Low Spend per Order: Indicate that they are likely lower-value products such products can be used as add-ons during promotions to drive volume.
Order Mix data helps you understand the popularity of each product. If certain products show a decline in order mix compared to the prior year, it may indicate reduced customer interest or competition from other products while a rising order mix indicates growth in popularity.
Glossary
AOV of Total Orders
This shows the average order value when the selected product is part of the customer's order.
Spend per Order
The amount spent on the specific product when it is included in an order.
Number of Orders
Total count of orders placed by customers. It is calculated by counting the number of orders.