Analyse Conversion Funnel Stages by % of Prior Funnel Stage
Conversion > Conversion Funnel > KPI Funnel > % of Prior Funnel Stage
Summary
The report shows the progression of customers through various stages of the customer journey in the form of a funnel and shows the percentage of customers that move from one funnel stage to the next, helping you to pinpoint areas that need attention for improving your conversion rate.
Questions the report answers
- How well does each stage of the customer journey perform?
- How does each stage performance compare to the previous period or year?
- Which stage of the customer journey needs attention and optimization?
How to read the report
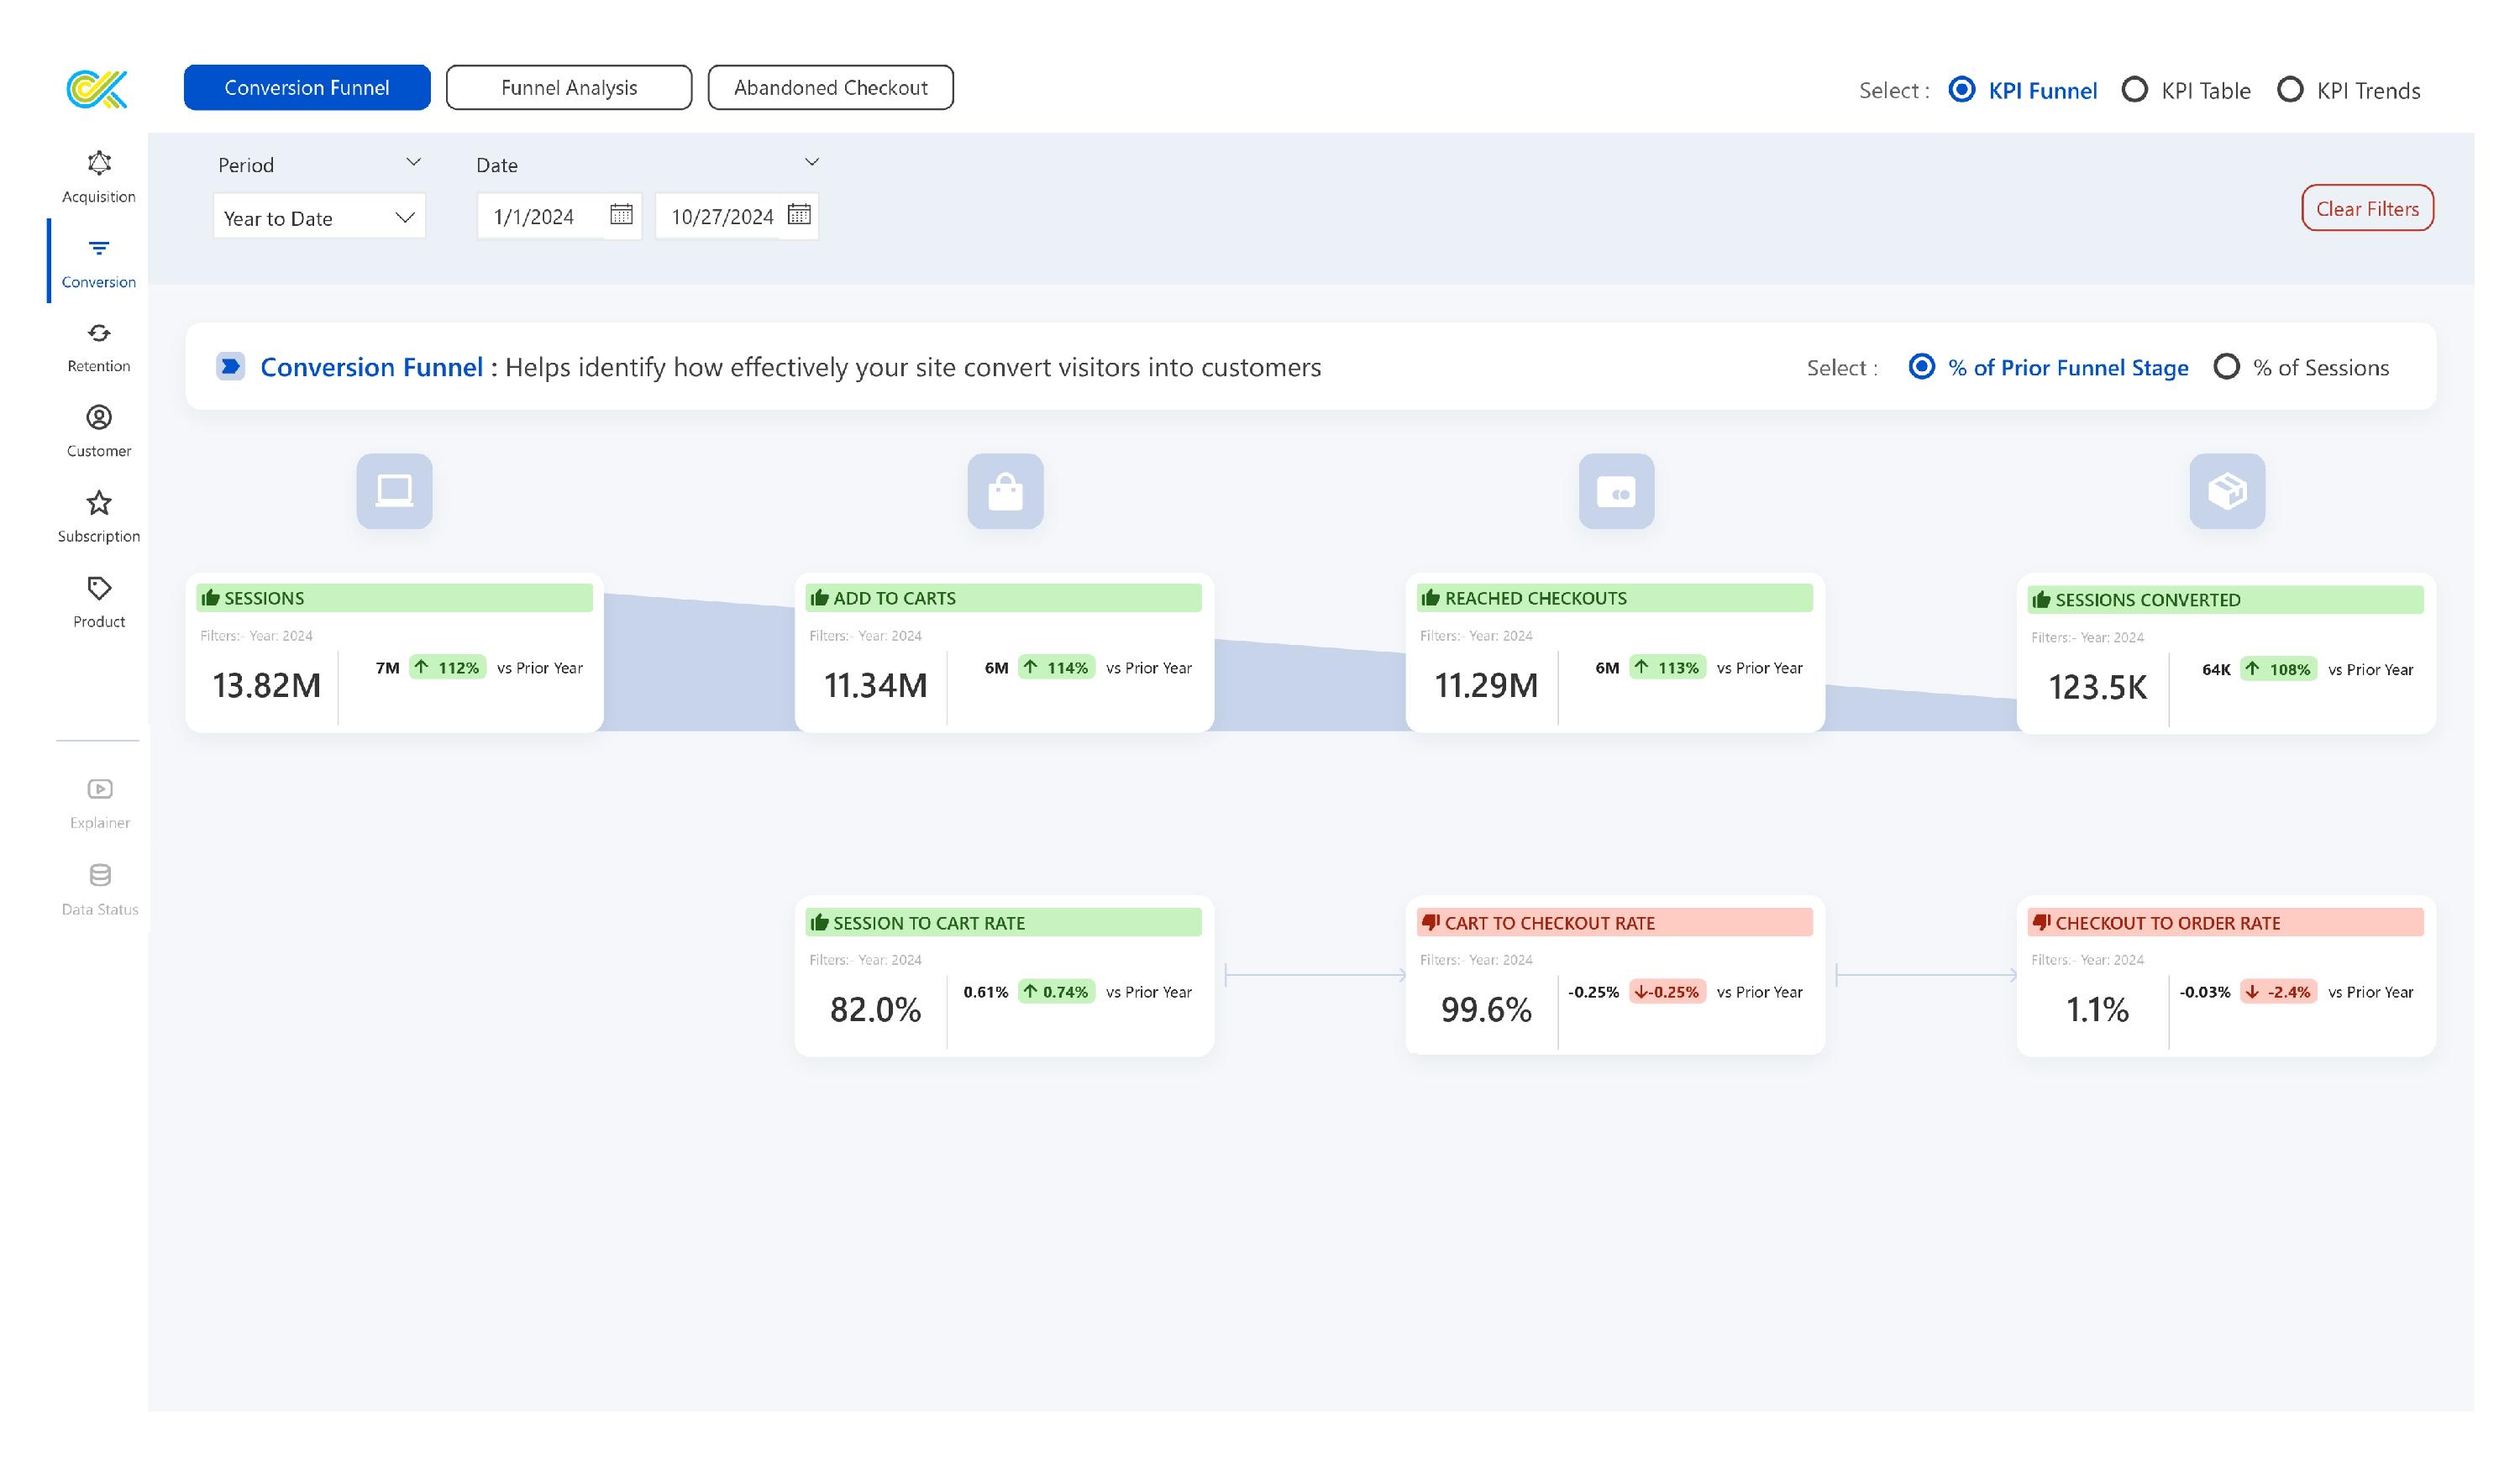
The KPI Funnel report typically breaks down key steps in the customer journey, visually representing how well each stage performs relative to the prior stage. Each stage in the funnel provides insights into the performance of your site in converting visitors into customers, highlighting potential drop-off points where improvements might be needed.
Understanding Each Funnel Stage
- Sessions: This is where the journey begins. A session is recorded each time a visitor lands on your site. Increasing session counts is often linked to effective marketing campaigns and improved SEO.
- Add to Carts: This measures the number of visitors who add a product to their cart during their session. The add-to-cart rate indicates how well your product selection, product details, and promotions are resonating with visitors.
- Reached Checkouts: This stage counts how many visitors who added products to their cart initiated the checkout process.
- Sessions Converted: This metric counts the number of sessions that ended with a purchase, meaning the customer successfully converted.
Key Performance Metrics
- Session to Cart Rate: This rate represents the percentage of sessions that led to users adding products to their cart.
- High Session to Cart Rate: A high percentage suggests that your product pages are optimized well, encouraging visitors to add products to their cart.
- Low Session to Cart Rate: A low percentage suggests that your product pages need optimization, consider optimizing product pages with clear descriptions, high-quality images, and reviews, and highlighting USPs (unique selling points) to enhance engagement.
- Cart to Checkout Rate: This percentage indicates how many users moved from adding items to their cart to initiating the checkout process.
- High Cart to Checkout Rate: A high rate means users are comfortable with their selected products and are motivated to complete the purchase.
- Low Cart to Checkout Rate: A low rate might suggest friction, such as hidden costs, and cumbersome forms.
- Checkout to Order Rate: This rate reflects the percentage of users who began the checkout process and completed it by placing an order.
- High Checkout to Order Rate: If users are completing the checkout successfully, it’s a good sign that your payment methods, forms, and processes are user-friendly.
- Low Checkout to Order Rate: A low rate at this final step is costly, as it indicates a high drop-off of users ready to buy.
Understanding the KPI Card

- Metric Title: This is displayed at the top left corner and defines what the KPI is measuring. Examples include “Sessions,” “Add to Carts,” “Reached Checkouts,” etc.
- Time frame: Just below the metric title you’ll see a time filter label providing you context for the period being analyzed in the KPI.
- Actual Value: The most prominent figure on the card is the Actual Value of the KPI for the selected period.
- YoY Variance: On the right side of the KPI card you’ll see the absolute YoY Variance and YoY Variance % for the metric on the first row.
- Color Coding and Icons of the Title
- Green: Indicates a positive change — increase the metric value.
- Red: Indicates a negative change — decrease in the metric value.
- Yellow: Indicates no change in the metric value
- Tooltip: When hovering over the KPI card, a tooltip appears, providing a detailed view of the data. It includes a table and a 13-week trend chart that compares the current period with the previous one for the selected metric.
Glossary
Add to Cart
The total number of shopping carts created during the sessions tracked in Shopify. It is calculated by summing the total number of carts created.
Cart to Checkout Rate
The percentage of carts that reached the checkout stage. It is calculated by dividing the number of checkouts by the number of shopping carts created.
Cart to Checkout Rate =
Checkouts to Order Rate
The percentage of checkouts that result in a successful order. It is calculated by dividing the sessions converted by the total number of sessions reached at checkouts.
Checkout to Order Rate =
Sessions (Shopify)
The total number of sessions tracked in Shopify.
Session Converted
The total number of orders created during the sessions is tracked in Shopify.
Session Converted Rate
The percentage of sessions tracked by Shopify that resulted in an order. It is calculated by dividing the number of sessions by sessions converted.
Session Converted Rate =
Session to Cart Rate
The percentage of sessions that resulted in the creation of a shopping cart on Shopify. It is calculated by dividing the number of add-to-cart by the total number of sessions
Session to Cart Rate =
Session to Checkout Rate
The percentage of sessions that result in a checkout being initiated. It is calculated by dividing the reached checkout by the total number of sessions.
Session to Checkout Rate =