Track Same Product Reactivation Post-Cancellation by Product
Subscription > Cancel to Reactivate > Product > Same Product Reactivation
Summary
The report shows how quickly customers reactivate their subscriptions for the same product after canceling. Understanding this behavior helps businesses pinpoint when customers return to the same products, enabling more targeted re-engagement timing and strategies.
Questions the report answers
- How soon do customers reactivate subscriptions for the same product after canceling?
- Are there specific weeks post-cancellation when reactivation peaks?
- How effective are re-engagement strategies in encouraging reactivation over time?
How to read the report
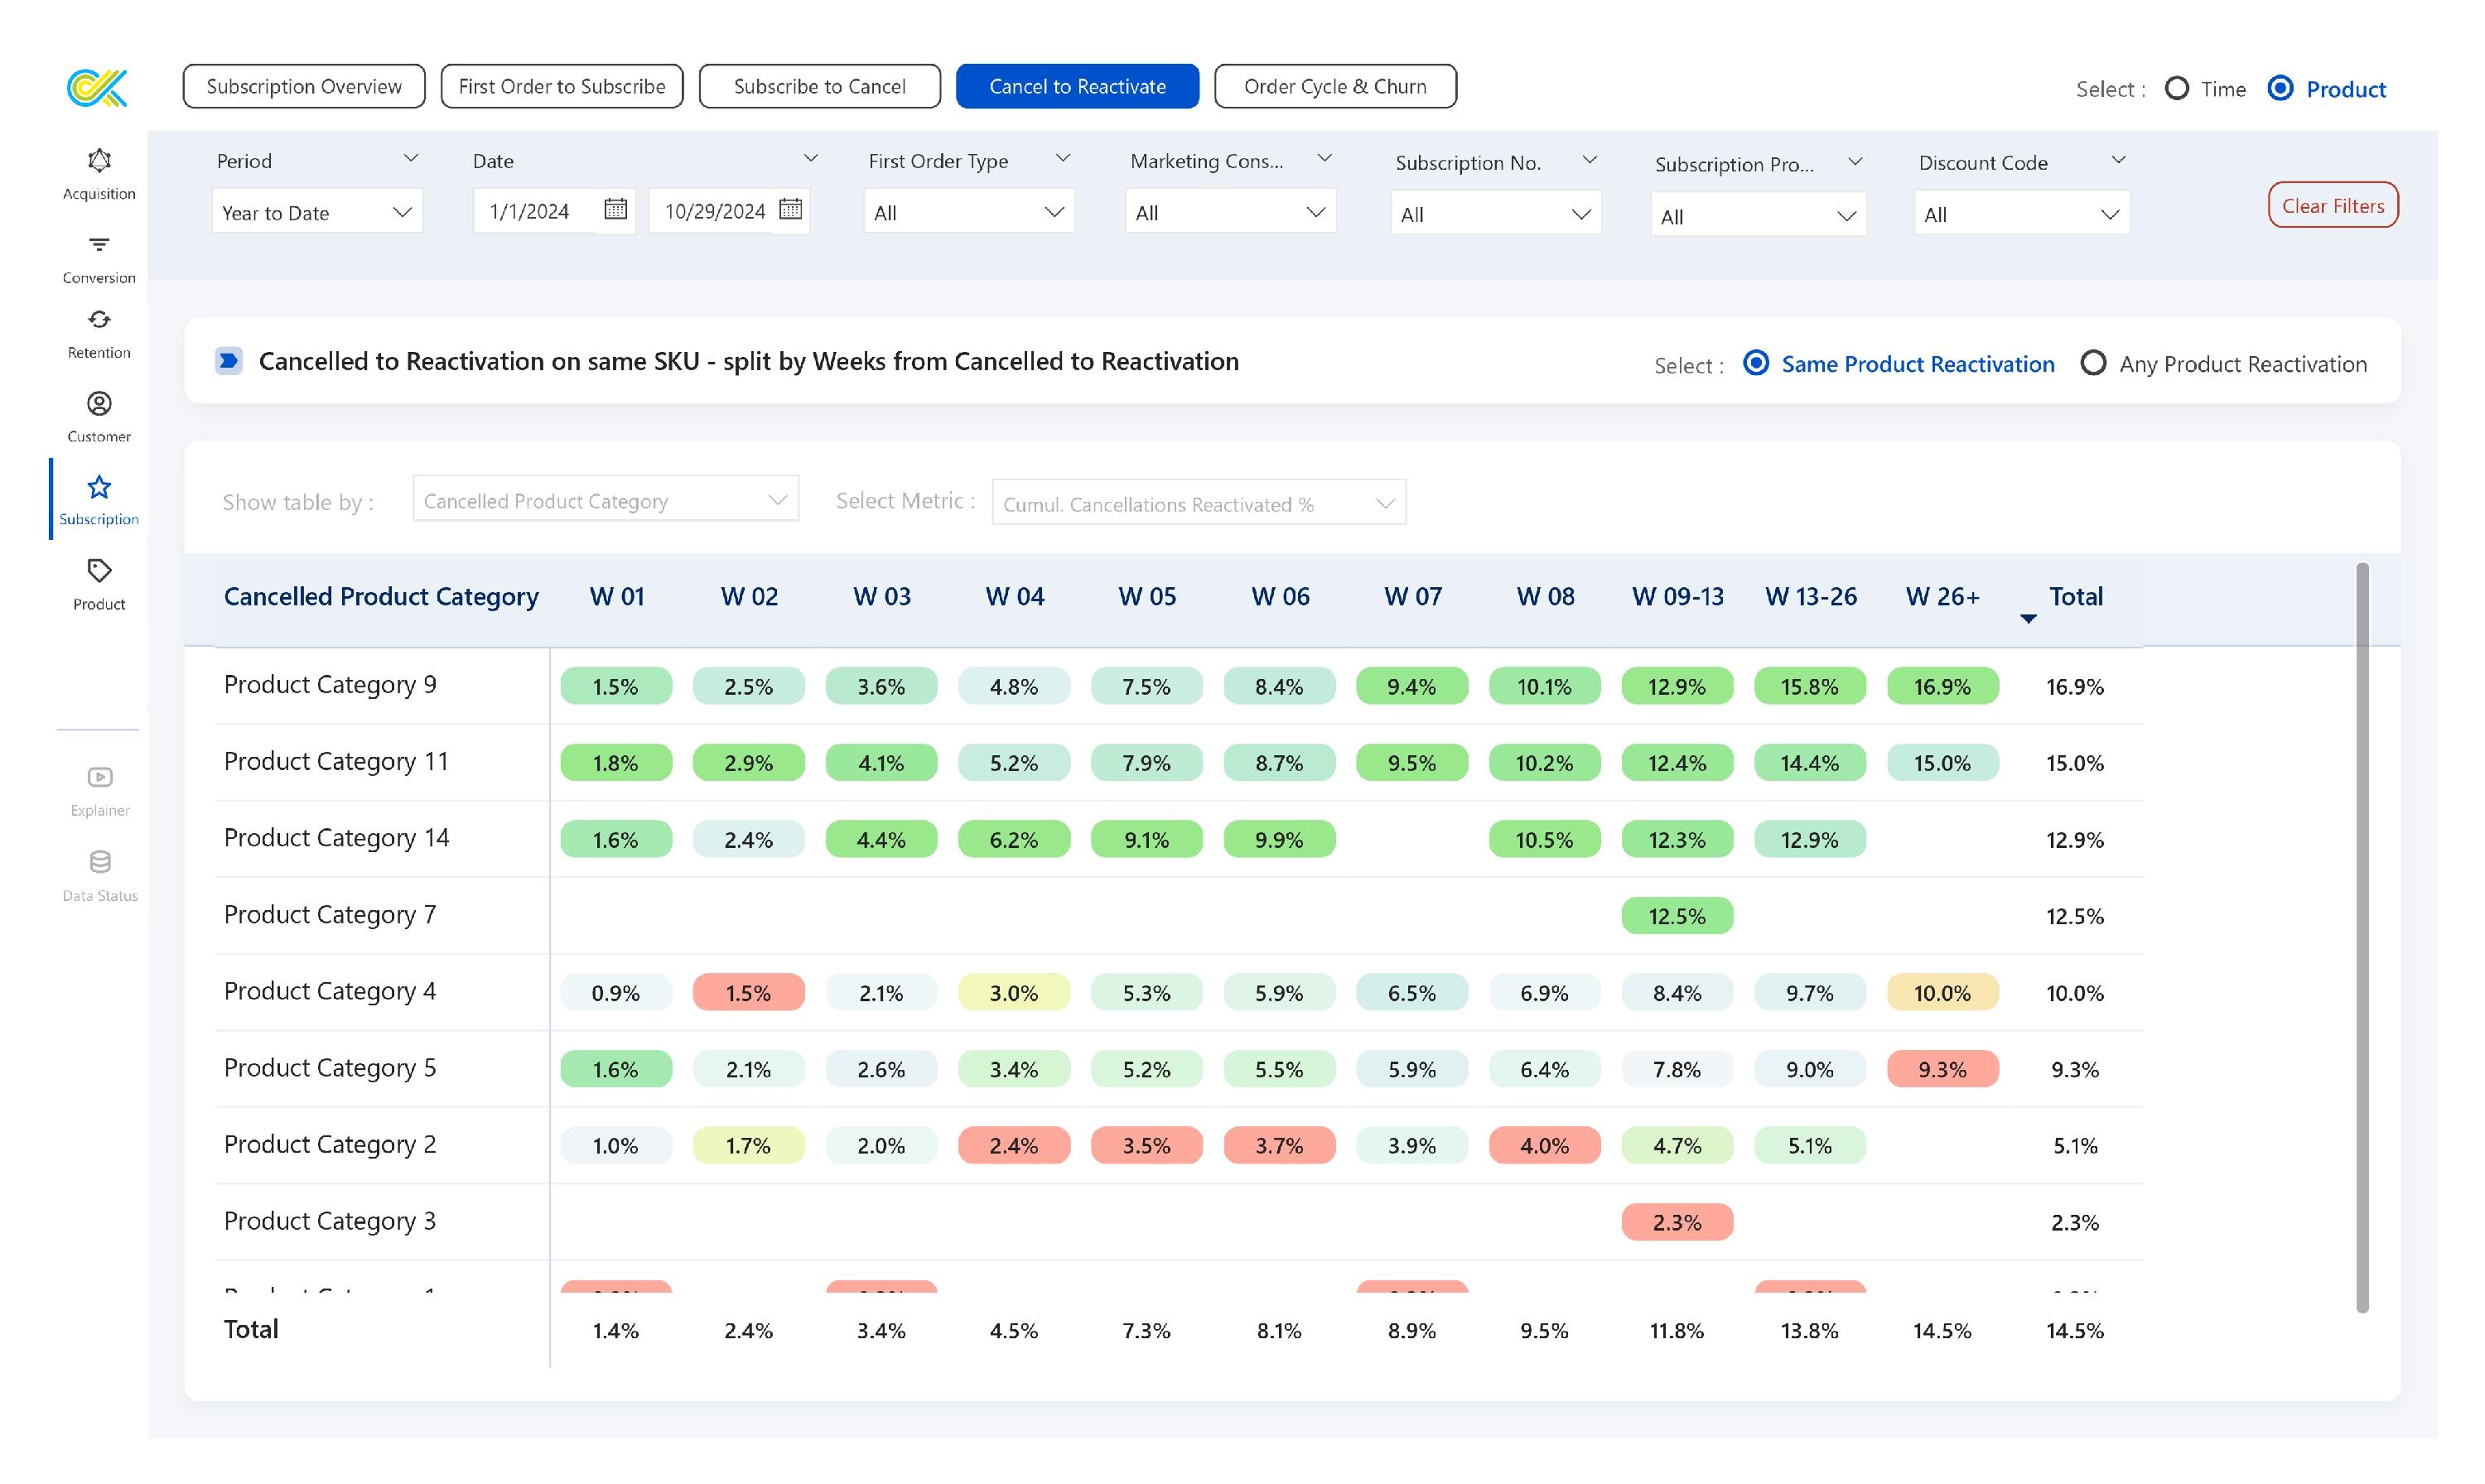
Each row represents a subscription cohort, while each column represents the weeks it takes for customers from that cohort to reactivate after the cancellation. It provides insight into when customers are most likely to reactivate, helping to time re-engagement strategies effectively.
- Top-to-Bottom Analysis (Cohort Comparison):
- By reading the table from top to bottom, you can compare different cohorts for the specific week helping you understand the reactivation performance and identify the best and worst-performing cohorts. For example, if the data shows that in Week 4, the Product Category 14 cohort had a reactivation of 6.2%, while the Product Category 2 cohort had a reactivation of 2.4%, this suggests that the Product Category 14 cohort responded better to re-engagement strategies at this stage.
- Left-to-Right Analysis (Trend Analysis):
- By reading the table from left to right tracks the progression of a single cohort across weeks, showing how subscription metrics grow, decline, or stabilize across weeks. This view helps you understand typical reactivation patterns and pinpoint when customers are most likely to return.
- By observing which weeks show the highest reactivation, businesses can pinpoint optimal times for sending re-engagement prompts, reminders, or incentives. For instance, if the data shows a spike in reactivation around Week 4, that may be a strategic time to engage with customers who recently canceled.
- You can compare reactivation between cohorts that might have experienced different campaigns or promotional periods. For instance, If a cohort from a promotional period shows a higher reactivation rate, this may indicate that customers acquired during certain campaigns are more likely to return, offering insights into effective acquisition channels
Switch between Metrics
Use the Select Metric dropdown to switch between available metrics, such as:
- Cancellation Reactivated: This metric reflects the absolute number of reactivations for the same product within a cohort, showing the volume of customers who reactivated.
- Cancellation Reactivated %: This metric shows the percentage of total subscribers from each cohort who reactivated, helping you understand the reactivation tendency at each stage.
- Cumulative Cancellation Reactivated: This metric shows the running total of reactivation for a cohort, indicating when reactivation begins to slow down or accelerate over time.
- Cumulative Cancellation Reactivated %: This metric shows the percentage-based cumulative view, helping users gauge the long-term reactivation rate for each cohort.
Switch Between the Product Attributes
You can switch between different Product Attributes using the Show table by dropdown, such as
- Cancelled Product Category
- Cancelled Product
- Cancelled SKU
Color Coding
The table uses color coding to help visualize the performance of different cohorts:
- Green: Indicates positive performance, such as a high percentage of Cancellation Reactivated.
- Red: Indicates underperformance, such as a low percentage of Cancellation Reactivated.
Glossary
Cancellation Reactivated
The number of subscribers who reactivated within a specific period.
Cancellation Reactivated %
The percentage of total subscribers who reactivated within a specific period.
Cumulative Cancellation Reactivated
The running total of subscribers who reactivated up to and including the selected period.
Cumulative Cancellation Reactivated %
The percentage of total subscribers who reactivated up to and including the selected period.